Core Algorithm Components
-
- Iris Detection
-
- Uses grayscale image processing to locate the iris boundary
-
- Employs a circle-scoring algorithm that searches for the strongest edge gradient
-
- Two-pass detection: coarse search followed by fine refinement
-
- Returns center coordinates, radius, and confidence score
-
- Pupil Detection
-
- Searches within the inner portion of the detected iris
-
- Uses adaptive thresholding based on the darkest 30% of pixels
-
- Fits an ellipse to the dark region using covariance matrix eigenvalue decomposition
-
- Extracts boundary points by ray-casting from center outward
-
- Returns center, major/minor axes, orientation angle, and boundary points
-
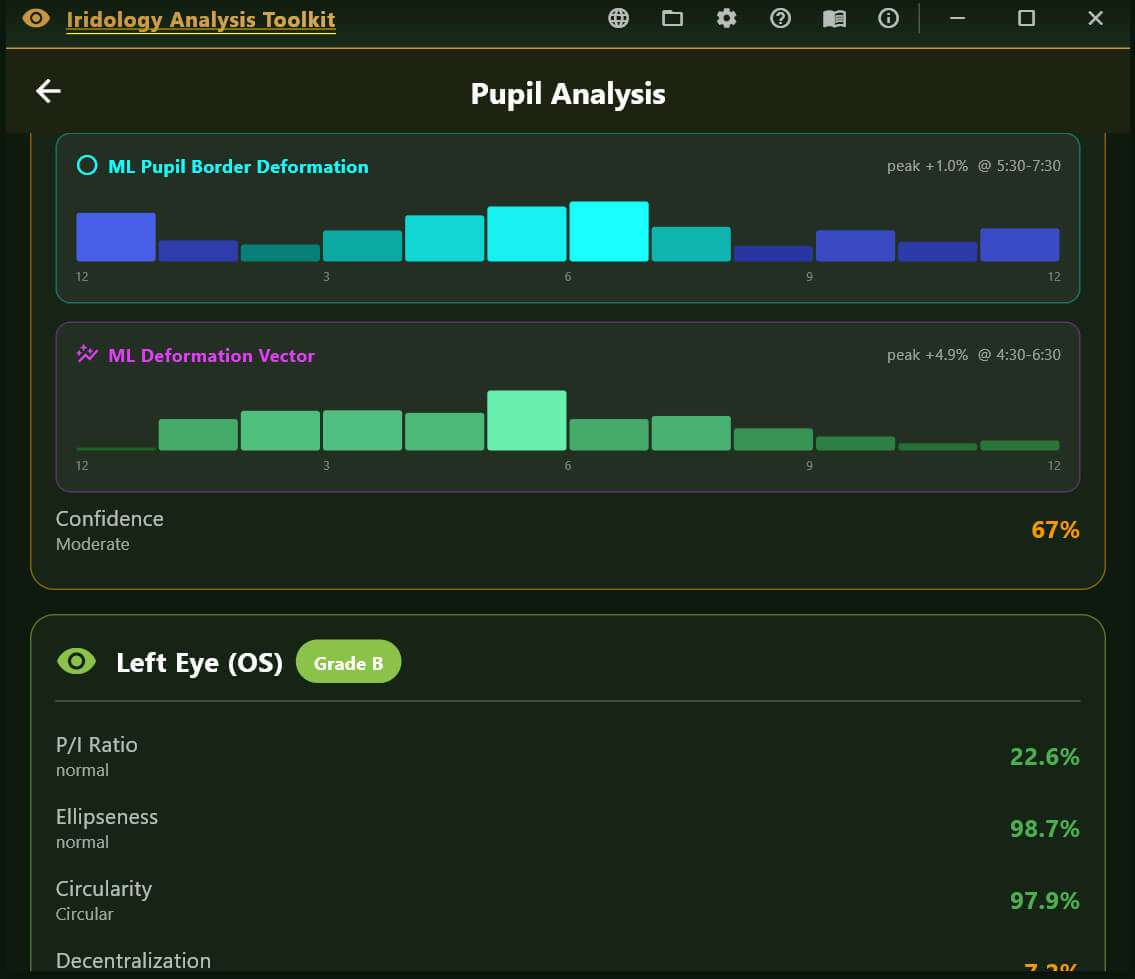
- Pupil Boundary Analysis
-
- Analyzes 72 boundary points (every 5 degrees) around the pupil edge
-
- Calculates deviation from the average radius at each clock position
-
- Groups deviations by clock hour (12 zones)
-
- Identifies flattenings (inward deviations) and protrusions (outward deviations)
-
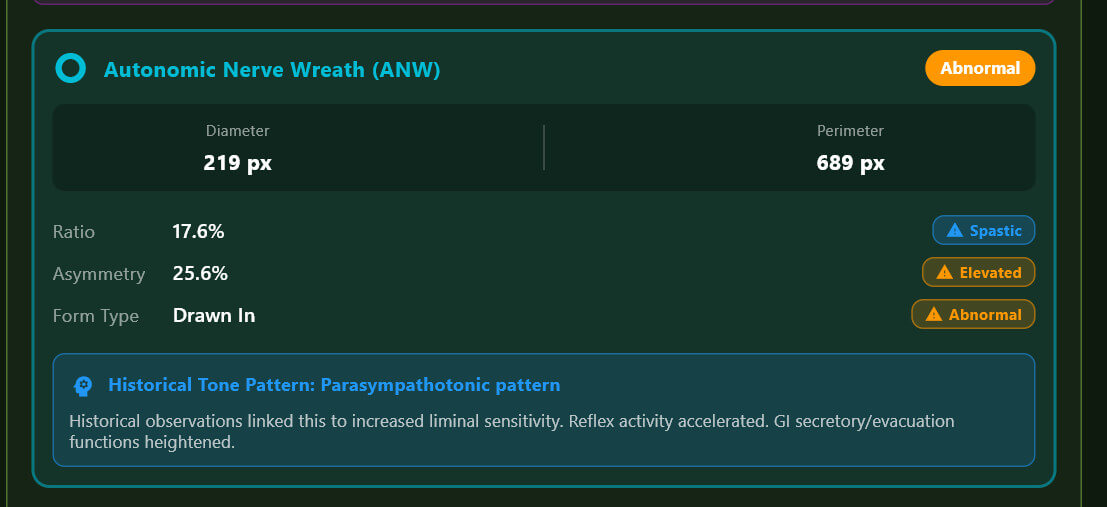
- ANW (Autonomic Nerve Wreath) Detection
-
- Searches for gradient changes between pupil edge and mid-iris
-
- Identifies the collarette boundary
-
- Calculates ANW ratio relative to iris diameter
Key Measurements Produced
| Parameter | Description | Normal Range |
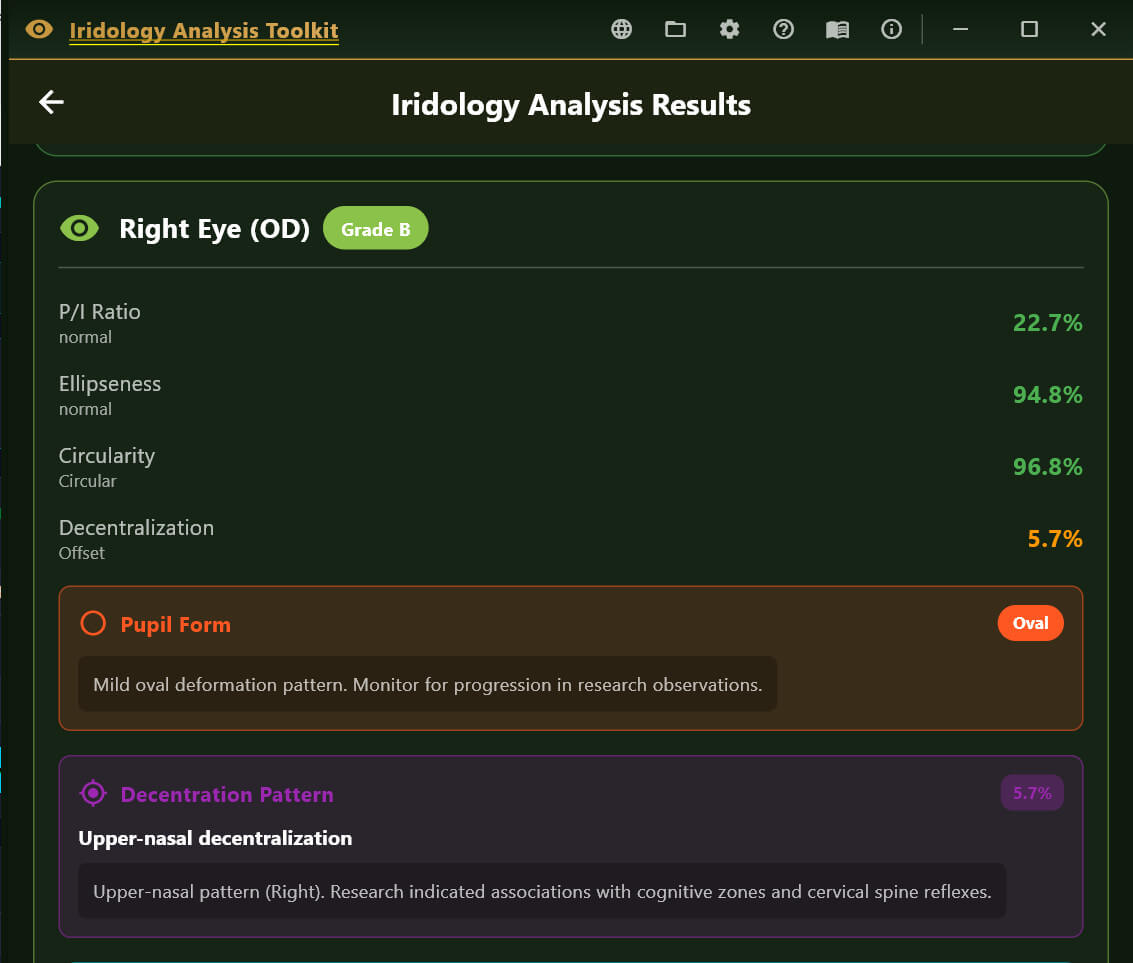
| P/I Ratio | Pupil diameter as % of iris diameter | 20-30% |
| Ellipseness | Minor/major axis ratio | >95% normal |
| Circularity | How circular the pupil boundary is | >95% normal |
| Decentralization | Pupil center offset from iris center | <5% normal |
| Deformation | Maximum boundary deviation | <5% normal |
| ANW Ratio | Autonomic nerve wreath position | 25-35% normal |
Zone-Specific Organ Associations
Each of the 8 pupil zones has specific organ associations for:
-
- Flattenings – Indicating hypofunction/weakness
-
- Protrusions – Indicating hyperfunction/irritation
· Shifts (e.g., “S: Middle-temporal shift.”)
· Constrictions (e.g., “Frontal zone constricted”)
· Form Type (Regular, Drawn In, Indented, Lacerated)
· Ratio Status (Spastic/Normal/Atonic)
· Asymmetry % with Normal/Pathology label
· Findings list
Iridology Chart Zone Overlay
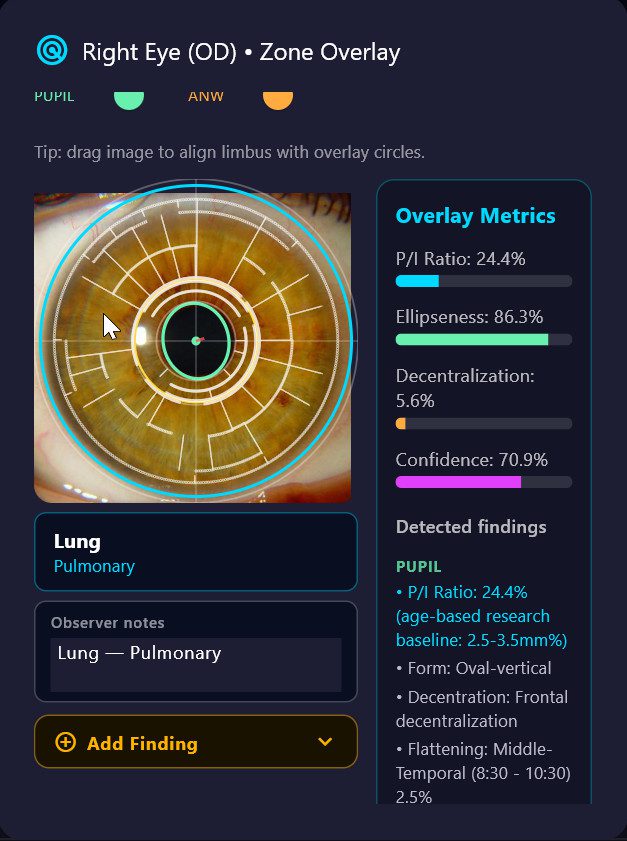
When **Show zone overlay** is on, the iris photo on the results screen displays an interactive polar overlay. Each clock-hour sector is tappable:
– Tap any zone to open its detail panel showing all FLAT/PROT/ANW findings in that zone, the associated organ system, and a text field for **observer notes**.
– Each tapped zone is **automatically appended to the Observer Notes field** in the format `Zone Name — Organ System`. Tapping the same zone twice will not create a duplicate entry.
– Additional free-text commentary can be typed directly in the Observer Notes field alongside the auto-populated entries.
– Observer notes are included as a named section in both the TXT report and the PDF report under “Observer Notes / Zone Overlay”.
– Notes are session-local — they are not stored in the database between sessions.
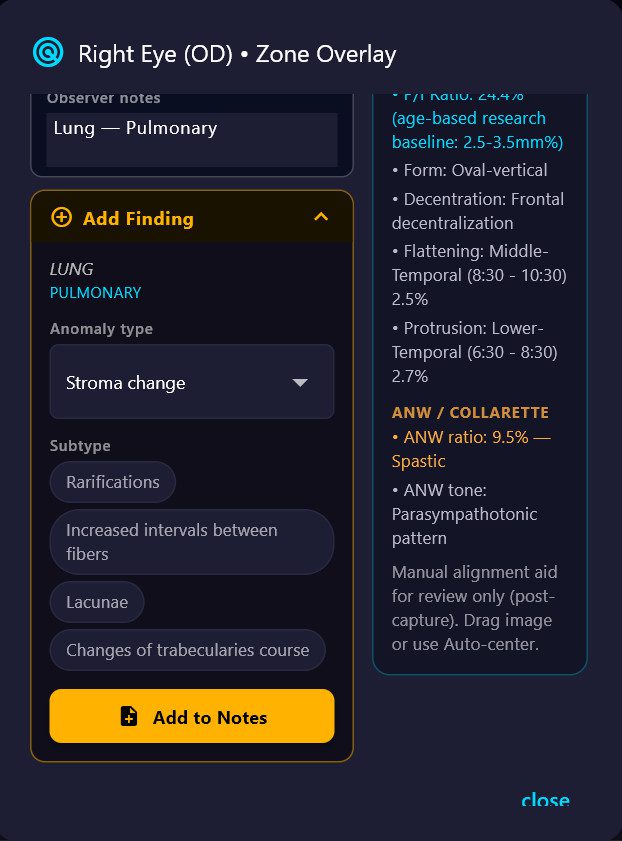
Iris Sign Finder (Add Finding)
Below the Observer Notes field, an **Add Finding** panel allows the practitioner to record structured iris sign observations for the currently selected zone.
**Workflow:**
1. Tap any zone on the polar overlay — the zone name and organ system are displayed and locked.
2. Tap the amber **Add Finding** header to expand the panel.
3. Select an **Anomaly type** from the dropdown. Organ-specific types appear at the top of the list automatically:
| Anomaly type | Notes |
| **Stroma change** | Structural fibre changes; select a subtype |
| **Organic pigment spot** | Pigmentation deposits; auto-generates clinical conclusion |
| **Slagging** | Microcirculation / connective tissue changes; auto-conclusion |
| **Toxic radii** | Radial sulci patterns; select a subtype |
| **Heterochromia** | Pigmentation variations; select a subtype |
| **Scurf rim** *(lung zones only)* | Local intoxication indicator; auto-conclusion |
| **Adaptive rings / arcs** *(lung zones only)* | Bronchospastic predisposition; auto-conclusion |
| **Autonomous wreath anomaly** *(cardiac zones only)* | ANW irregularity in cardiovascular zones |
4. If the selected type has **subtypes**, tap the appropriate chip (e.g. *Lacunae*, *Hyperemic sulci*, *Sectoral hyperpigmentation*).
5. Types with known clinical significance display an automatic **Conclusion** text drawn from the iridology reference database.
6. Tap **Add to Notes** – a structured entry is appended to the Observer Notes field in the format → Clinical conclusion text (if applicable)
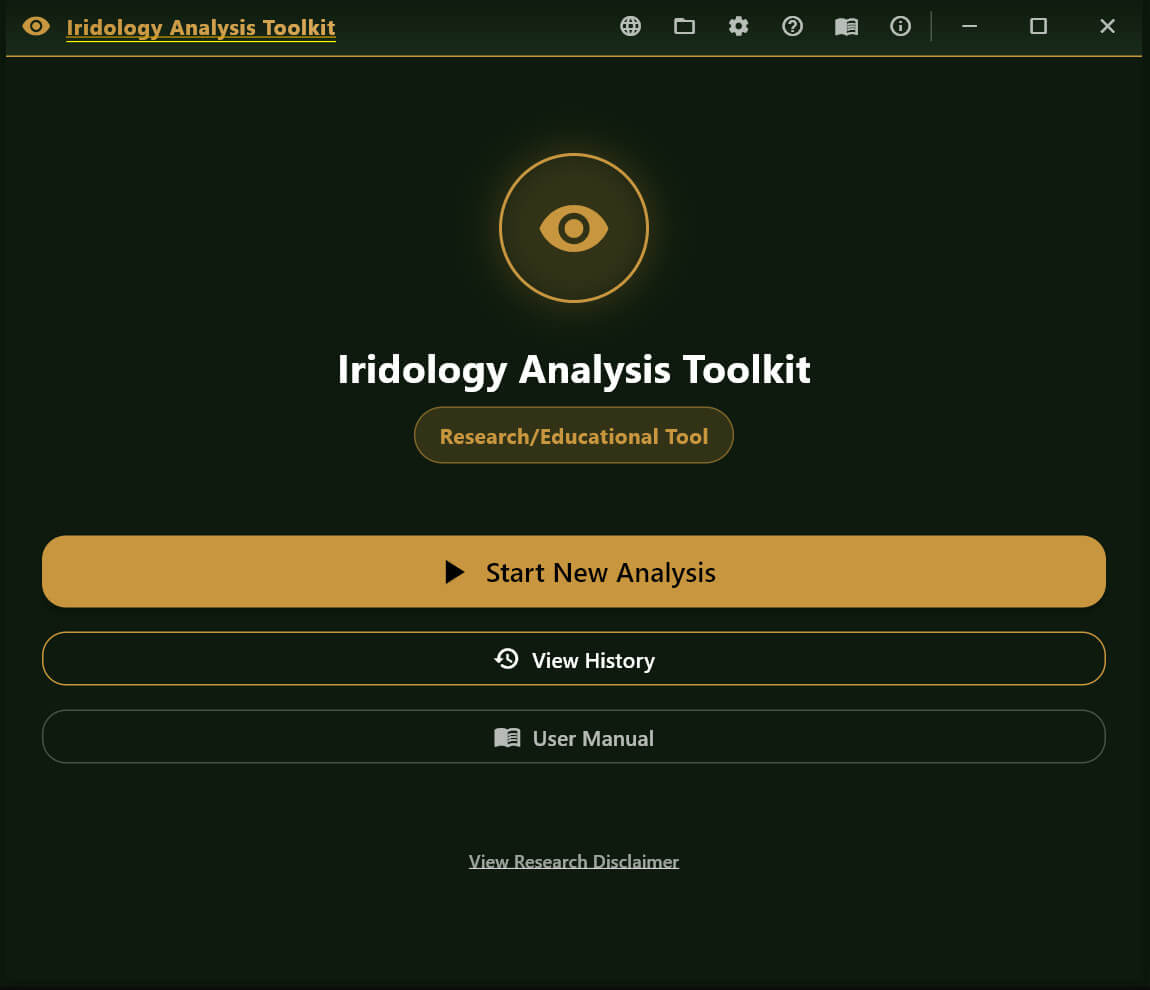
Main Application Features
Analysis Screen
Real-time eye validation before analysis
Progress indicator during processing
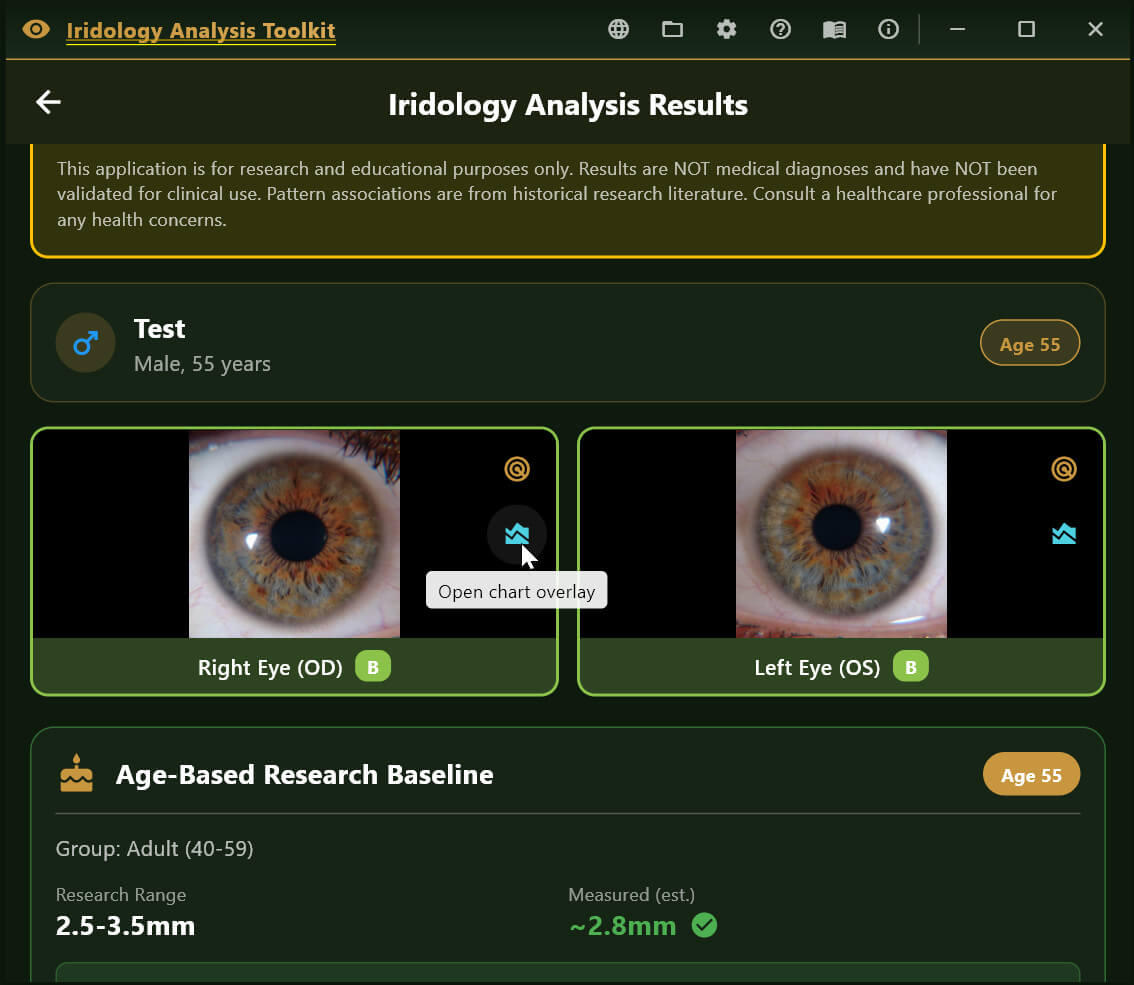
Displays all measurements with color-coded status
Shows organ associations for detected anomalies
Full descriptions for Pupil Form and Decentration Patterns
Reports Generated
On-Screen Results – Interactive cards with expandable details
TXT Report – Plain text with results section
JSON Report – Structured data for integration/archival
PDF Report – Professional formatted document with images
Enabling the Therapy Modules
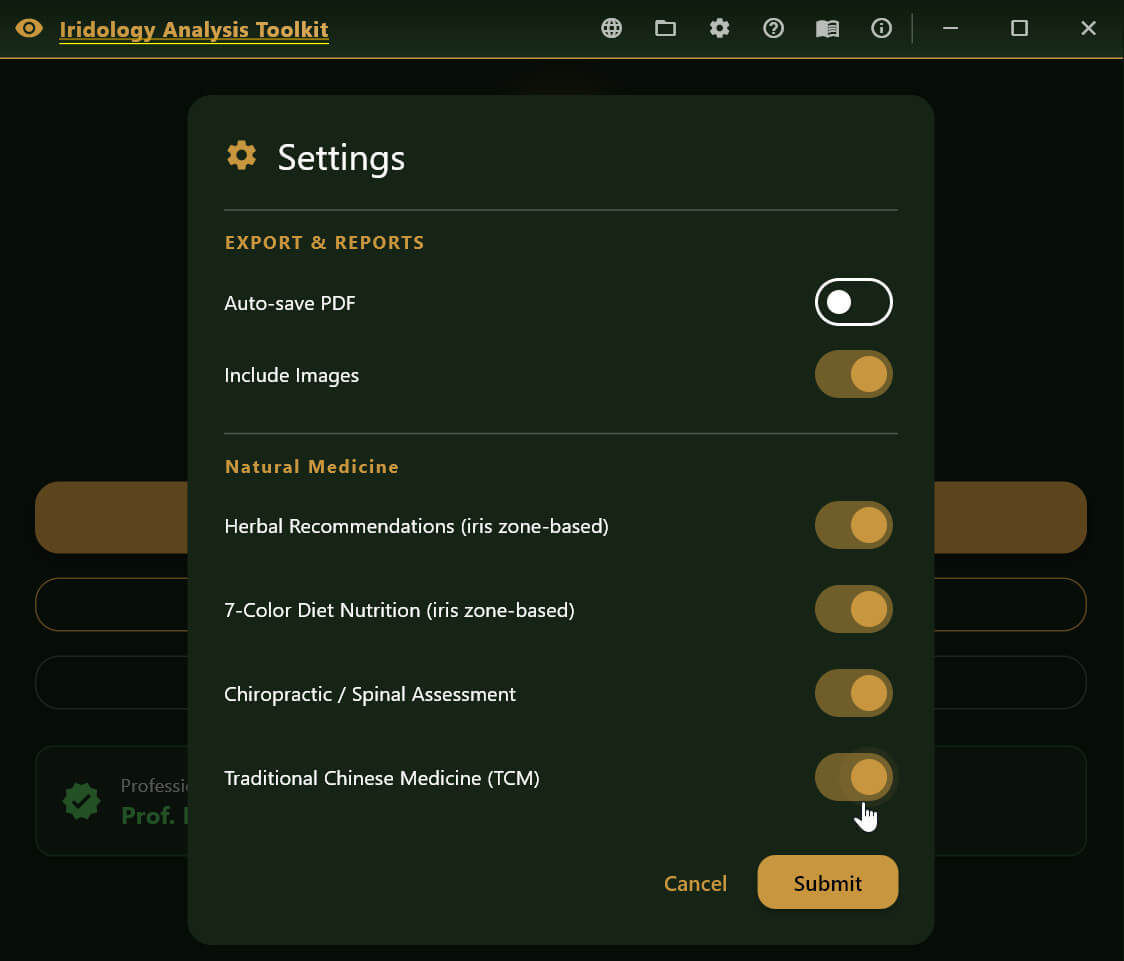
Each module is toggled independently in **Settings**. Disabled modules produce no panel and no PDF section.
How Zone Findings Drive the Therapy Panels
All four engines share the same iris zone input pipeline:
**Qualifying finding types**
| Finding type | Badge | Weighting in ranking |
| Flattening (lacuna / crypts) | **FLAT** | severity × 1.2 (highest priority) |
| Protrusion (raised sector) | **PROT** | severity × 1.0 |
| ANW shift (ring displacement) | **ANW** | deviation × 0.8 |
Findings are ranked by their weighted score. Each engine caps the number of displayed cards:
– Herbal engine: up to **6 zone cards**
– Nutrition engine: up to **6 zone cards**
– Chiropractic engine: up to **5 zone cards**
– TCM engine: up to **5 zone cards**
If a zone maps to an organ that the database does not cover, that zone is silently skipped. No recommendation card is generated.
**OD / OS labelling**
Every card carries an eye badge (**OD** = right / **OS** = left) so the practitioner knows which eye produced the finding. The iris zone map is mirrored between eyes: for example, the 9-o’clock zone is the right lung (OD) and the left lung (OS); the 3-o’clock zone is the left heart/pericardium (OS) and the right back/pleura (OD).
The herbal database (`assets/therapy/herbal_database.json`) is derived from a 5,722-page CNRI knowledge base. It is structured as:
condition name → list of herbs, each with a reference count.
The reference count reflects how many source documents cited that herb for that condition. Higher counts indicate broader cross-reference support.
**How it works**
- The engine takes the organ keywords associated with the triggered iris zone.
- It runs a case-insensitive prefix search across all condition names in the database.
- Up to **4 matching conditions** per zone are returned, each with up to **6 herbs** ranked by reference count.
- Zones are sorted so the highest-severity zone appears first.
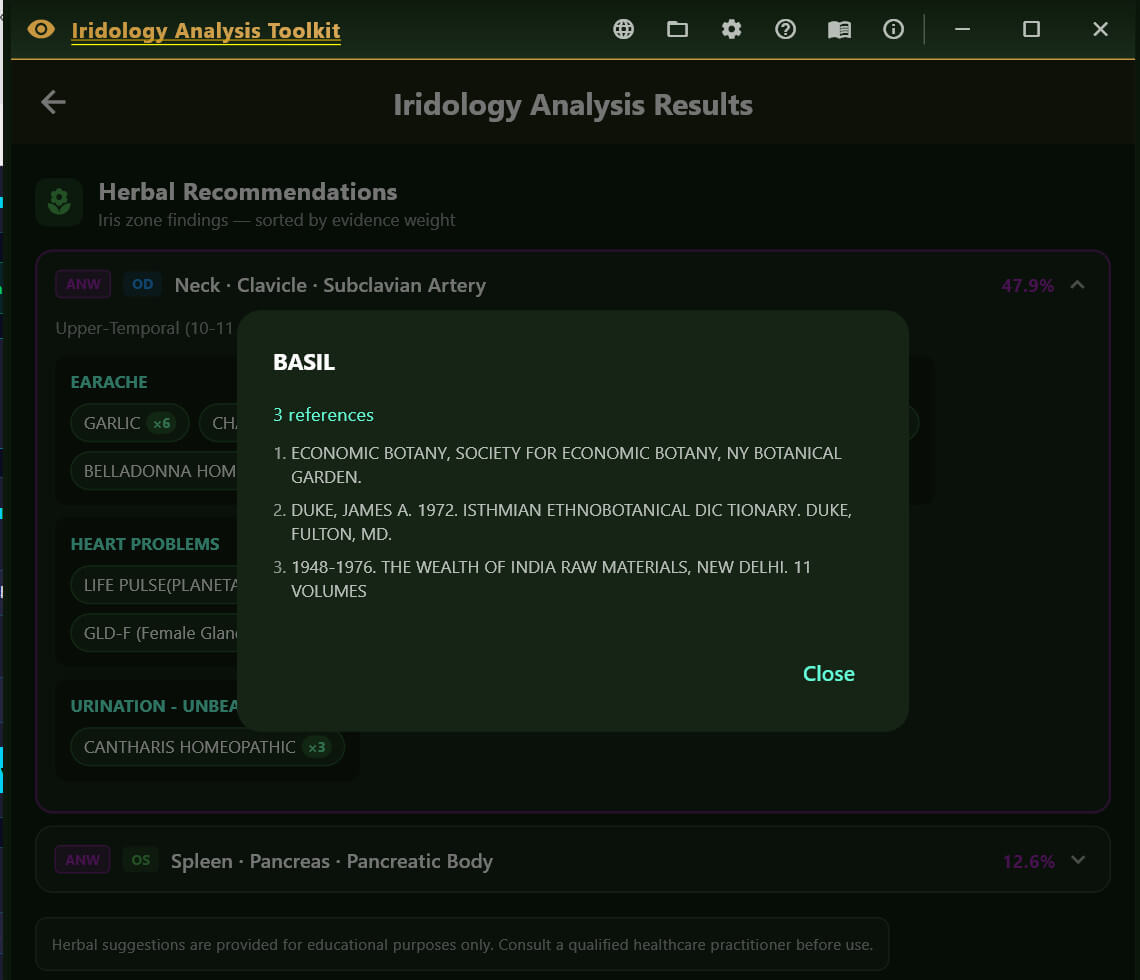
**What the panel shows**
Each recommendation card displays:
– **Eye badge** (OD/OS) and **finding badge** (FLAT/PROT/ANW)
– **Zone name** and associated organ system
– **Severity percentage** from the iris analysis
– **Matched conditions** — up to 4 condition names relevant to that organ
– **Herb list** per condition — herb name + reference count shown as a chip; tapping a chip opens the source reference list
– **Evidence note** — total number of references for the top herb
**Disclaimer strip**
A disclaimer is shown at the bottom of every herbal card and is also printed in the PDF. It reminds practitioners that herb–drug interactions exist and that professional supervision is required.
The nutrition database is structured around organ systems, with each organ entry containing:
– **Key nutrients** — vitamins, minerals, and cofactors known to support that organ
– **Color-coded foods** — foods grouped into 7 diet colors (Red, Orange, Yellow, Green, Blue/Purple, White, Brown)
– **Supportive herbs** — culinary and medicinal herbs cross-referenced to that organ
– **Organ support notes** — brief clinical rationale for the dietary approach
**The 7-Color Diet framework**
The color system is derived from the phytonutrient literature: each color group provides a different spectrum of antioxidants, flavonoids, and co-factors. The panel presents color groups as visual chips so practitioners can give patients an intuitive shopping guide.
| Color group | Representative phytonutrients |
|————-|——————————-|
| Red | Lycopene, anthocyanins |
| Orange | Beta-carotene, hesperidin |
| Yellow | Lutein, zeaxanthin |
| Green | Chlorophyll, sulforaphane, folate |
| Blue/Purple | Resveratrol, anthocyanins |
| White | Quercetin, allicin (alliums) |
| Brown | Lignans, beta-glucans (whole grains) |
**When an iris zone maps to multiple organs** (e.g. the lower-basal zone maps to Kidney + Adrenal + Leg), the engine merges the nutrient, food, and herb lists from all matched organs and de-duplicates them. The `matchedOrgans` list on each card shows which organs contributed data.
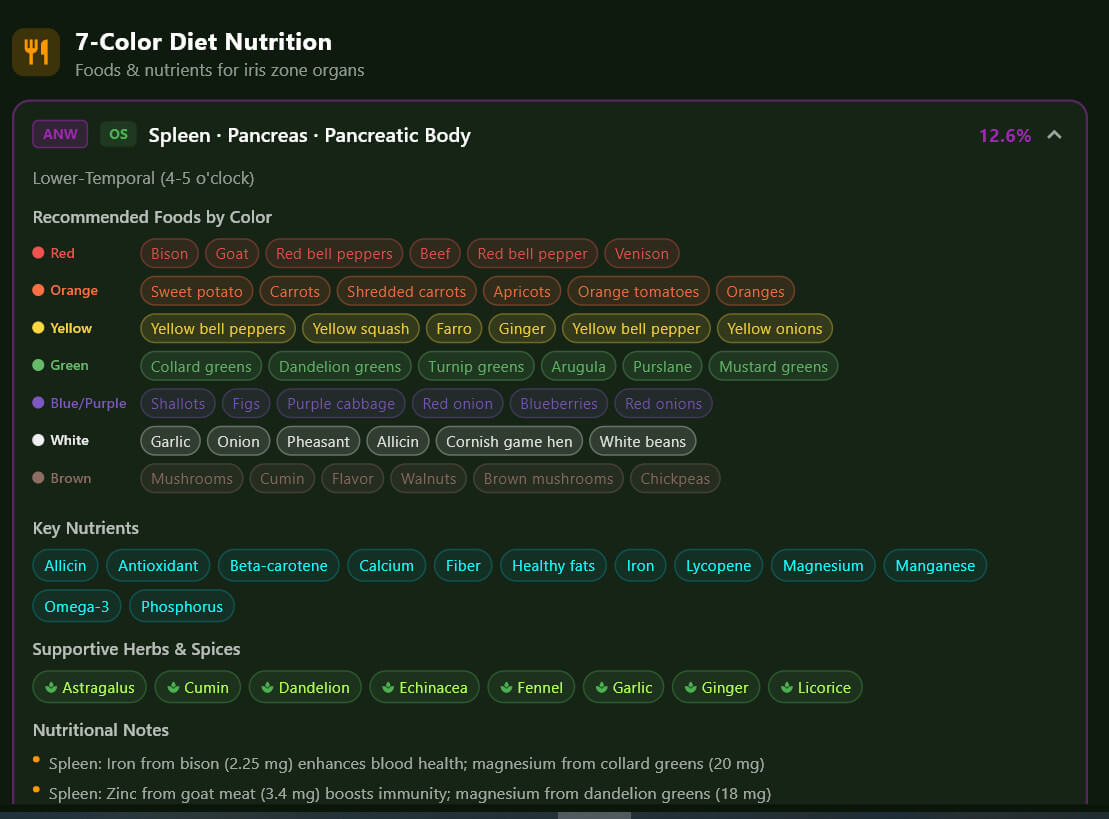
**What the panel shows**
Each card displays:
– **Zone and organ**, finding type badge, severity
– **Key nutrients** — listed in priority order
– **Color-food grid** — up to 4 foods per color group, displayed as coloured chips
– **Supportive herbs** — small herb chips distinct from the herbal recommendations module
– **Organ support note** — a one-sentence clinical rationale for the dietary focus
Spinal segment data is compiled directly into the app (no external asset file is loaded at runtime). The zone-to-segment mapping follows the **pupillary-border iridology convention**:
| Iris clock position | Spinal region |
|——————–|—————|
| 12 o’clock (upper-central) | Upper Cervical C1–C4 |
| 10–11 / 1–2 o’clock (upper) | Mid/Lower Cervical C4–C7 |
| 9 / 3 o’clock (middle) | Upper Thoracic T1–T6 |
| 7–8 / 4–5 o’clock (lower) | Lower Thoracic T7–T12 |
| 6 o’clock (lower-basal) | Lumbar / Sacral L1–S3 |
Both eyes map to the **same spinal column** — the spine is midline, so OD and OS findings at the same clock position point to the same vertebral level.
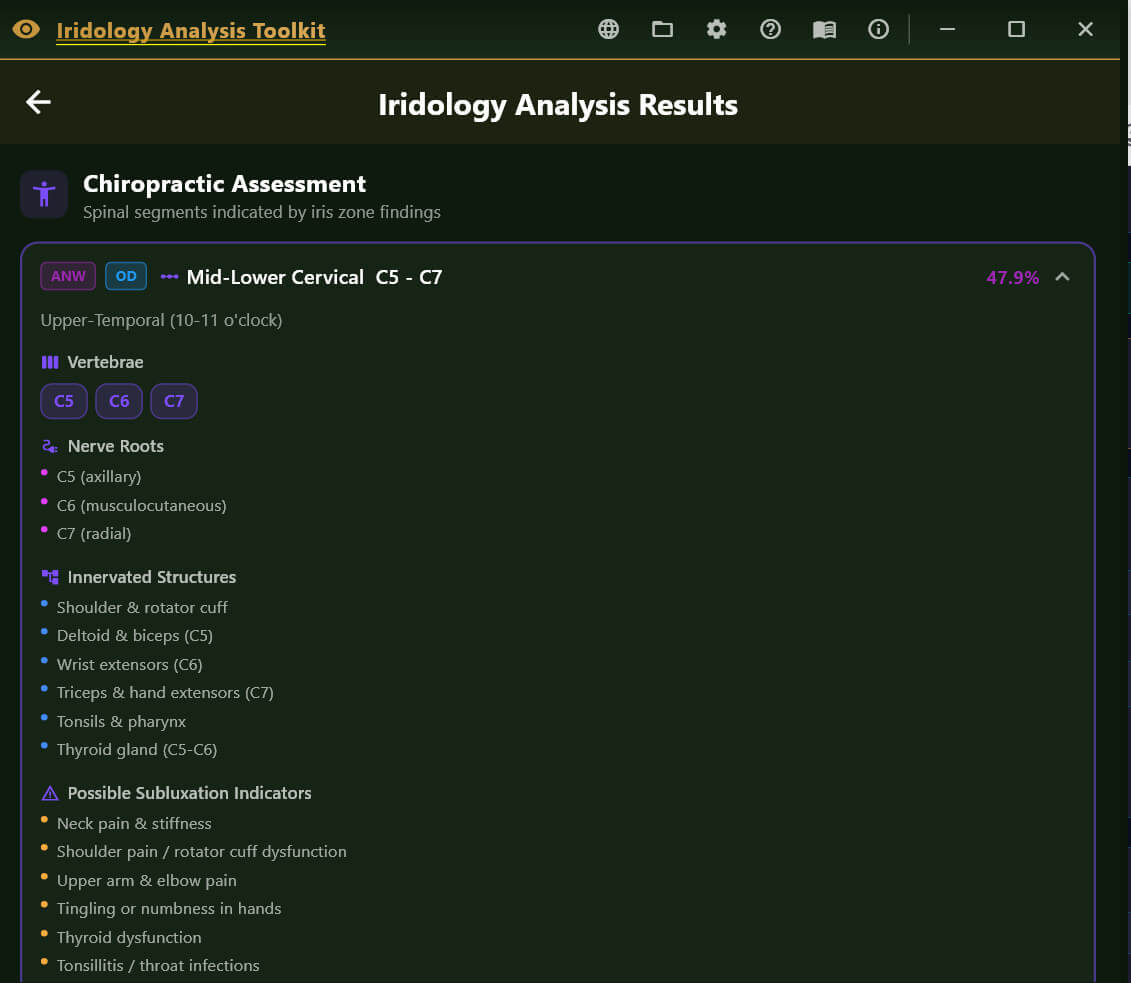
**What the panel shows**
Each spinal segment card displays:
| Section | Contents |
|———|———|
| **Segment label** | e.g. “Upper Cervical C1–C4” |
| **Vertebrae** | Individual vertebrae with common names (e.g. C1 Atlas, C2 Axis) |
| **Nerve roots** | Exiting nerve roots at that level |
| **Innervated structures** | Organs and tissues supplied by those nerves |
| **Subluxation indicators** | Classic symptoms associated with fixation at this level |
| **Affected muscles** | Muscles commonly involved in nerve compromise at this level |
| **Adjusting approach** | Standard chiropractic techniques applicable to the region |
| **Exercises** | Corrective exercises, stretches, and lifestyle recommendations |
| **Postural note** | Ergonomic or postural guidance specific to this spinal region |
**Sources**
Winsor (1921) sympathetic segmental disturbances study; Cleveland Chiropractic College nerve–organ chart; Palmer textbooks; Velchover, Jensen and Angerer references.
TCM data is compiled into the app (no external file). Each iris zone × eye-side combination maps to a specific TCM organ system entry. The TCM map is eye-side-specific: for example, the middle-temporal zone is the **right lung** in OD and the **left heart / pericardium** in OS — which is the same distinction already present in the iridology iris zone map.
**Five Elements framework**
Each TCM organ belongs to one of the Five Elements (Wu Xing):
| Element | Color | Season | Climate | Taste | Emotion | Sense organ |
|———|——-|——–|———|——-|———|————-|
| **Wood** | Green | Spring | Wind | Sour | Anger / Frustration | Eyes |
| **Fire** | Red | Summer | Heat | Bitter | Joy / Anxiety | Tongue |
| **Earth** | Yellow | Late Summer | Dampness | Sweet | Worry / Overthinking | Mouth |
| **Metal** | White/Grey | Autumn | Dryness | Pungent | Grief / Sadness | Nose |
| **Water** | Blue/Black | Winter | Cold | Salty | Fear / Will-power | Ears |
The element colour is used as the card accent throughout the panel.
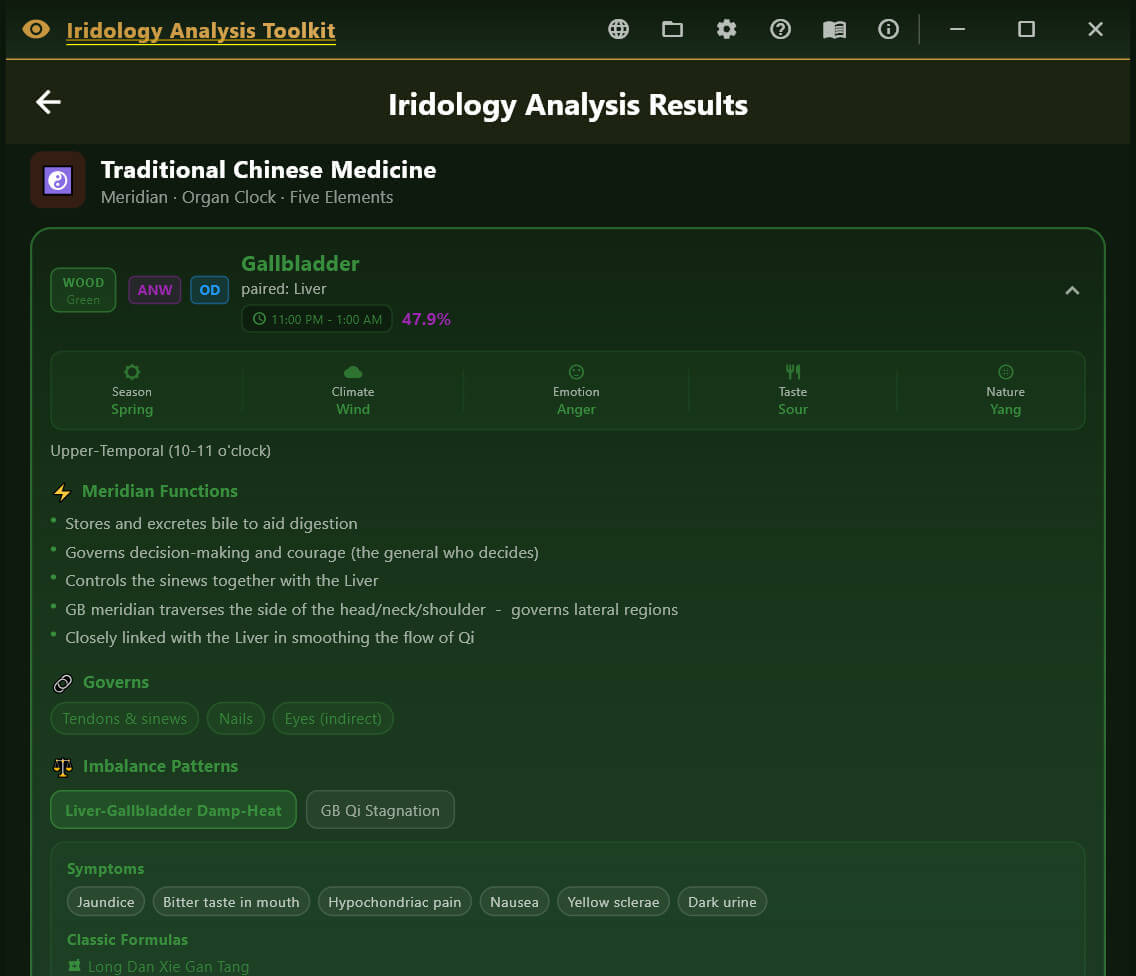
**What the panel shows**
Each TCM card displays:
| Section | Contents |
|———|———|
| **Organ pair** | Primary organ + paired organ (e.g. Liver ↔ Gallbladder) |
| **Element bar** | Element name, season, climate, emotion, taste, nature (Yin/Yang) |
| **Meridian clock** | Peak 2-hour energy window (e.g. Liver: 1–3 AM) |
| **Meridian functions** | Key physiological roles in TCM theory |
| **Governs** | Body tissues governed (e.g. Liver governs tendons, nails, and the eyes) |
| **Patterns** | Common TCM imbalance patterns; each pattern lists symptoms, classical herbal formulas, and key acupoints |
| **Acupoints** | Top acupressure/acupuncture points with brief descriptions |
| **Tonifying foods** | Foods that nourish this organ in TCM dietary therapy |
| **Foods to moderate** | Foods that may stress this organ when consumed in excess |
**Imbalance patterns**
Each pattern card shows:
– Pattern name (e.g. “Liver Qi Stagnation”, “Heart Blood Deficiency”)
– Key symptoms in bullet form
– Classical formula names (e.g. *Xiao Yao San*, *Tian Wang Bu Xin Dan*)
– Primary acupoints (WHO standard point codes, e.g. LV3, HT7)
**Sources**
Maciocia (2005), Deadman & Al-Khafaji (2007), WHO acupoint standards (2008), Pitchford, Flaws, and compiled Jilin/Shanghai TCM texts.
Reading Therapy Panels Together
The four panels are designed to be **complementary, not redundant**. A practitioner might use:
– **Herbal panel** → identify specific botanical agents with the strongest cross-reference evidence for the affected organ system
– **Nutrition panel** → build a dietary protocol using the 7-color food guide for the same organ
– **Chiropractic panel** → identify the spinal level most likely to have neuro-functional involvement with that organ
– **TCM panel** → frame the clinical picture within Five Element theory, select meridian points, and recommend classical formulas
All four draw from the same iris zone findings, so the same flattening that generates an herbal recommendation also appears in the nutrition, chiropractic, and TCM panels – allowing the practitioner to build a cohesive multi-modality protocol from a single iris analysis session.
Additional Features
Now available in 16 languages, EN,ES,FR,DE,PT(BR-PT),IT,KR,JA,PL,HI,AR,ZH(CN-TW),RU,TR
Age-based pupil size assessment
Bilateral comparison between eyes
Serial Scan history with database storage
Download Iridology Analysis Toolkit PDF results sample with “optional” Natural Medicine Suggestions (Herbal, Nutrition, Chiropractic, TCM):
1: Sample PDF Report (mild issues)
2: Sample PDF Report (extensive issues)
Download and Install Iridology Analysis Toolkit – Windows
Iridology Analysis Toolkit software is certified under the Microsoft Developer Program to ensure trust and safety!
![]()
Download and Install Iridology Analysis Toolkit – Android